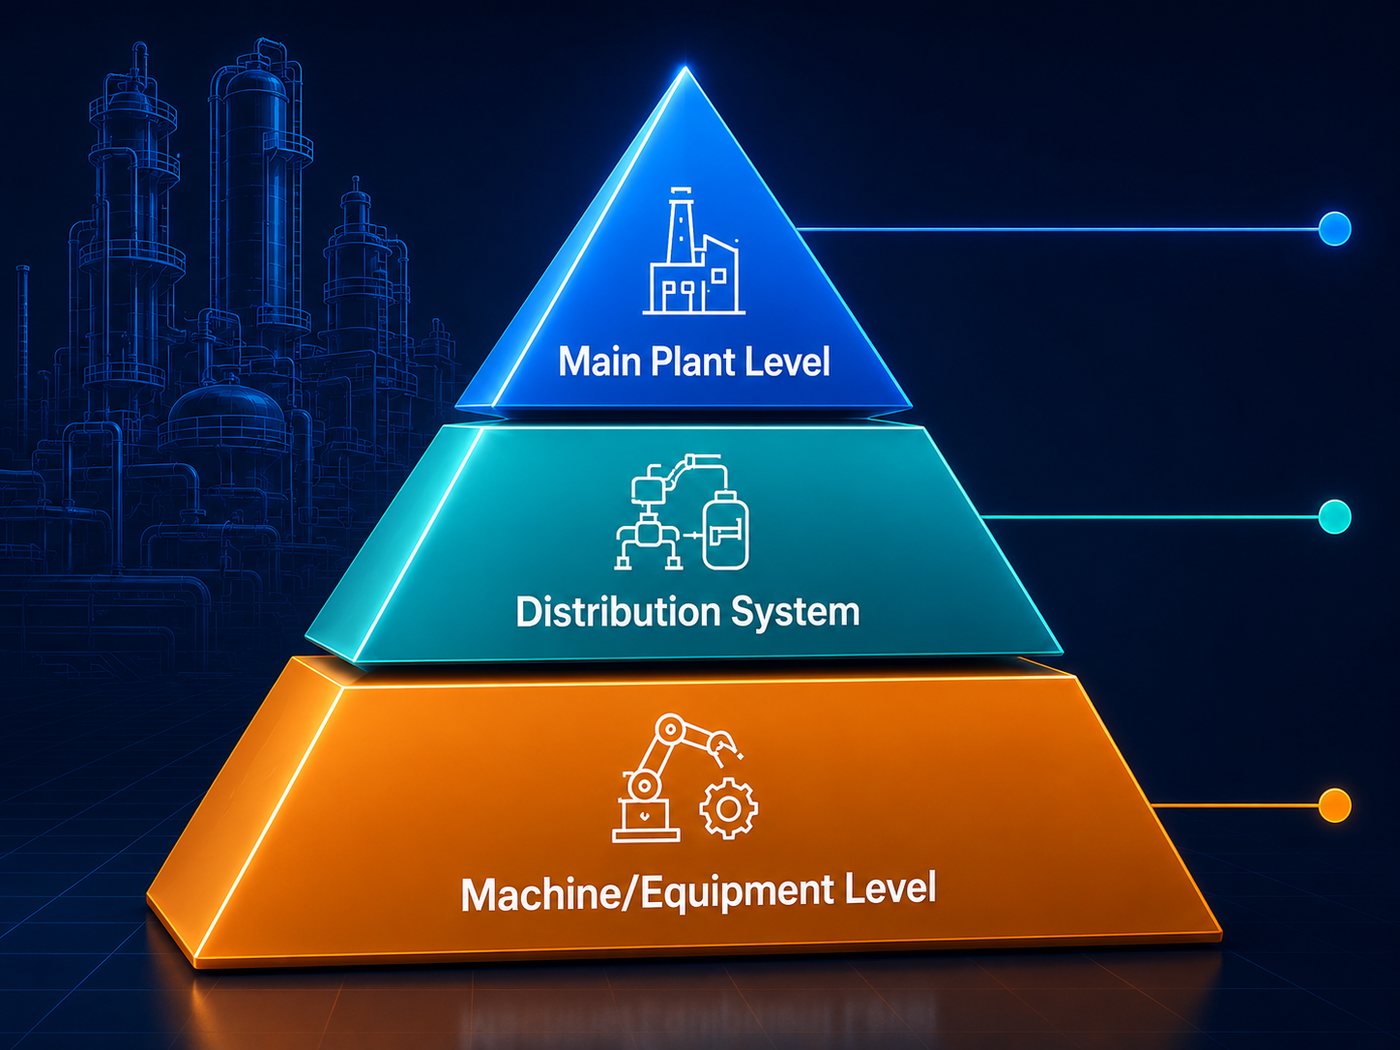
Main Plant Level
Energy Strategy • KPIs • Production Planning
- Electricity & gas bill analysis
- Production-linked energy planning
- Steam, compressed air and thermo-oil strategy
- Board-level savings and payback roadmap
Electricity, gas, biomass, thermo-oil and hydrocarbon fuel analysis with measurements, digital analytics and ROI action planning.
A clear view from machine-level measurements to boardroom energy strategy.
Energy Strategy • KPIs • Production Planning
Utility Flow • Losses • Department Benchmarks
Measurements • Controls • Operating Behaviour
Submit basic energy, production and contact data for an initial industrial performance review.
Interactive animated graphs using hypothetical plant data which can be replaced later with actual measurements.
X-axis: Time of Day. Y-axis: Power Load (kW) and Production Output (Ton).
This graph helps management understand how plant power demand changes across different time periods.
This graph visualizes how system efficiency and power cost index move over different operating points.
X-axis: Operating Points. Y-axis: Efficiency (%) and Power Cost Index.
Measurements and site validation for authentic savings calculations.
kW, kVA, PF, voltage, harmonics, transformer and motor loading.
Panels, busbars, steam lines, insulation, hot spots and heat losses.
Vibration testing, sound and noise, humidity, ambient temperature and system condition.
Compare audit types for boardroom decision-making.
| Category | Energy Audit | Productivity Audit | Digital Twin Audit | Excellence Audit |
|---|---|---|---|---|
| Objective | Energy reduction and utility cost control. | Production efficiency and energy vs production cost reduction. | Sustained profitability through plant-wide performance intelligence. | Executive excellence maturity, market readiness and management performance improvement. |
| Primary Focus | Reduce utilities and energy consumption. | Reduce production cost with productivity improvement. | Whole plant performance efficiency and sustainability. | Certifications, KPIs, quality, digital readiness, market position and customer value. |
| Engineering Method | Energy measurements and loss analysis. | Process analysis plus KPI benchmarking. | Digital twin simulation plus AI modelling. | Multi-driver executive assessment plus benchmarking and leadership roadmap. |
| Decision Intelligence | Energy saving action plan. | Productivity strategy and operational improvement plan. | Data-driven futuristic action plan. | Boardroom excellence scorecard, priorities and market domination roadmap. |
| ROI Potential | Low to medium — energy conservation. | Medium — production gains and energy saving. | Highest — multi-dimensional sustained savings. | Strategic ROI — export readiness, credibility and enterprise competitiveness. |
| Savings Scope | Energy bills only. | Productivity and capacity increase. | Energy + Productivity + Quality + Maintenance. | Energy + Production + Quality + Digital + Market + Management Excellence. |
| Best For | Facilities focused on energy conservation. | Plants with production and energy focus. | Industry leaders seeking dominance. | CEOs and exporters seeking enterprise-level excellence positioning. |
| Typical Payback | 12–24 months. | 6–18 months. | 6–12 months with multi-impact ROI. | Strategic payback through savings, reputation, market access and leadership control. |
 Food & Beverages
 Feed Mill
 Textile Mill
 Industrial Automation & Drives
 Power PLants
 Mega Projects
 Tyre Manufacturing
 Oil Processing
 Confectionary
 Chemical Processing
 Particle Board Manufacturing
 Pipe Manufacturing
 Sugar Mill
 Oil Mill
 Chemical Processing Plant
 Flexible Packaging
 Paint Manufacturing
 Packaging Films
 Chemical Processing
 BOPP FIlm ManufacturingFood & BeveragesFeed MillTextile MillIndustrial Automation & DrivesPower PLantsMega ProjectsTyre ManufacturingOil ProcessingConfectionaryChemical ProcessingParticle Board ManufacturingPipe ManufacturingSugar MillOil MillChemical Processing PlantFlexible PackagingPaint ManufacturingPackaging FilmsChemical ProcessingBOPP FIlm Manufacturing
Connect with TEAM for industrial energy, productivity, digital twin, and performance optimization assessment.

We help industrial leadership teams reduce energy cost, improve production efficiency, strengthen operational control, and build ROI-driven action plans for sustained savings.