Executive Digital Twin Level
Dashboard • Scenarios • ROI Simulation
- Management dashboards for performance, cost and risk
- What-if scenarios and investment decision support
- ROI simulation and sustained savings governance
Simulation, process corridors, AI diagnostics, KPI dashboards and data-driven futuristic action plans.
SCADA, meters, PLC, historian, Excel and operator data integration.
Operating envelopes, control corridors and scenario simulation.
ROI roadmap, predictive insights and boardroom dashboards.
A futuristic digital structure linking sensors, system models and executive dashboards.
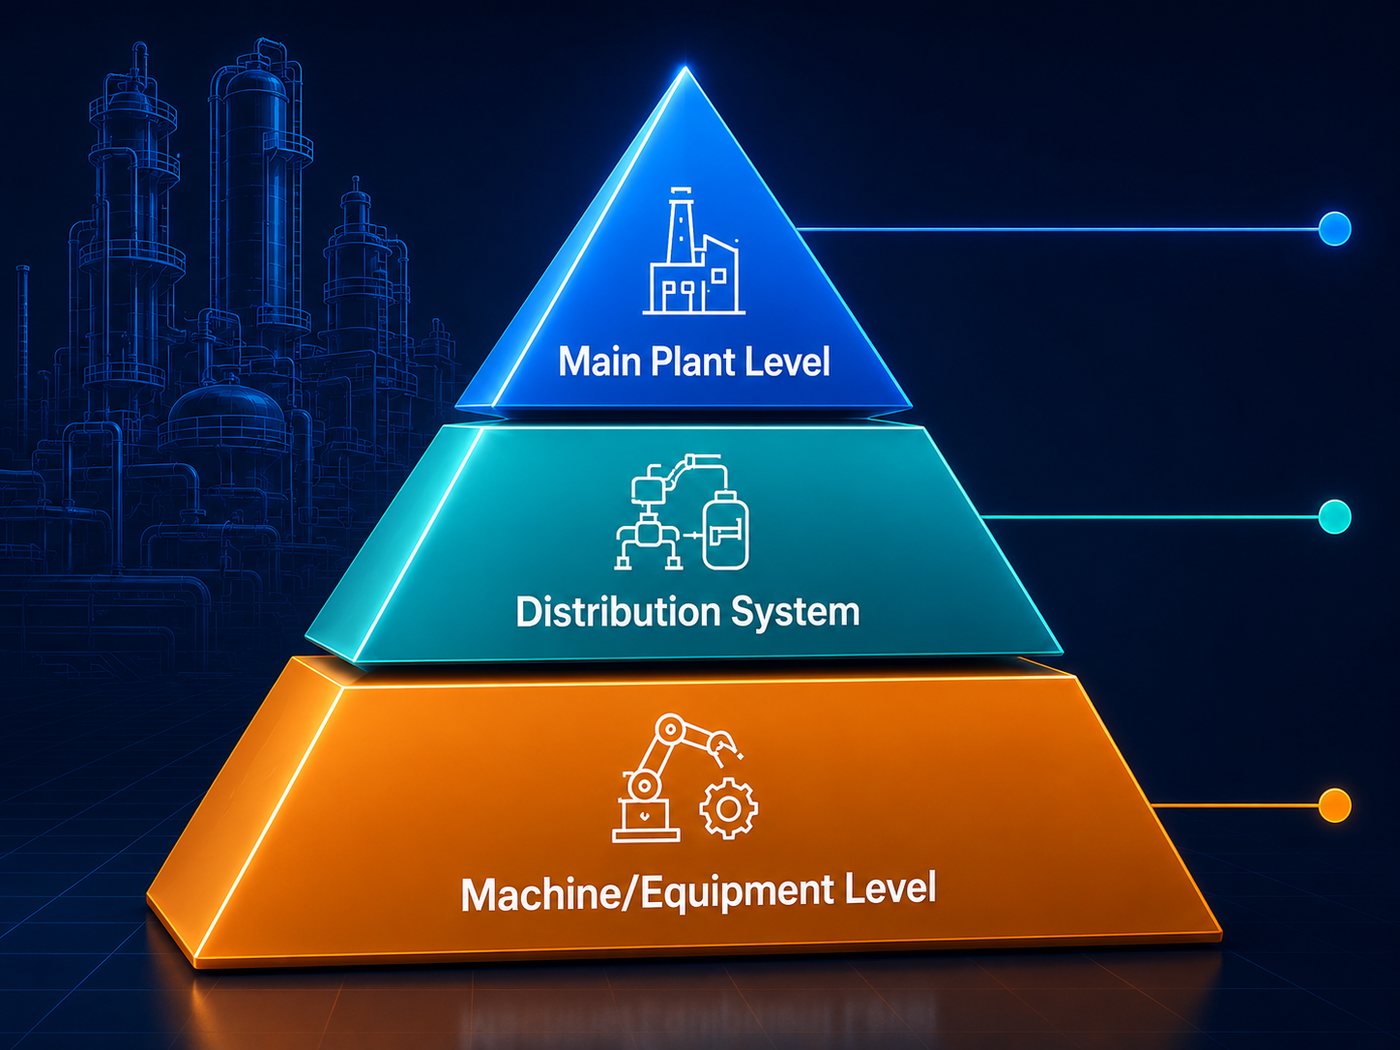
Dashboard • Scenarios • ROI Simulation
Utilities • Process Models • Data Pipelines
Meters • Machines • Operating Envelopes
Interactive animated graphs using hypothetical plant data which can be replaced later with actual measurements.
X-axis: Time of Day. Y-axis: Power Load (kW) and Production Output (Ton).
This graph helps management understand how plant power demand changes across different time periods.
This graph visualizes how system efficiency and power cost index move over different operating points.
X-axis: Operating Points. Y-axis: Efficiency (%) and Power Cost Index.
 Food & Beverages
 Feed Mill
 Textile Mill
 Industrial Automation & Drives
 Power PLants
 Mega Projects
 Tyre Manufacturing
 Oil Processing
 Confectionary
 Chemical Processing
 Particle Board Manufacturing
 Pipe Manufacturing
 Sugar Mill
 Oil Mill
 Chemical Processing Plant
 Flexible Packaging
 Paint Manufacturing
 Packaging Films
 Chemical Processing
 BOPP FIlm ManufacturingFood & BeveragesFeed MillTextile MillIndustrial Automation & DrivesPower PLantsMega ProjectsTyre ManufacturingOil ProcessingConfectionaryChemical ProcessingParticle Board ManufacturingPipe ManufacturingSugar MillOil MillChemical Processing PlantFlexible PackagingPaint ManufacturingPackaging FilmsChemical ProcessingBOPP FIlm Manufacturing
Connect with TEAM for industrial energy, productivity, digital twin, and performance optimization assessment.

We help industrial leadership teams reduce energy cost, improve production efficiency, strengthen operational control, and build ROI-driven action plans for sustained savings.